Running a Shopify store gives you access to a large amount of business data: orders, sales trends, product performance, customer behavior, inventory movement, and revenue patterns. The problem is that many merchants do not have enough time to manually analyze all of this information.
Spreadsheets can help, but they quickly become slow, messy, and difficult to maintain. When your store grows, manual reporting can lead to missed opportunities, delayed decisions, and unclear performance tracking.
This is where a Shopify analytics reporting app becomes valuable. A good analytics app helps you understand what is happening inside your store, which products are driving revenue, where performance is improving or declining, and what actions you should take next.
In this article, we will look at how a Shopify analytics reporting app can help merchants make smarter decisions, improve product performance, and understand store KPIs more clearly.
Why Data Matters in eCommerce
In eCommerce, decisions based only on instinct can become expensive. Store owners need clear data to understand what is working, what is not working, and where growth opportunities exist.
Without proper analytics, you may not know:
Which products generate the most revenue
Which products have weak performance
When sales increase or decline
Which marketing activities are producing results
Where customers drop off before purchasing
Whether inventory decisions are based on real demand
A Shopify analytics reporting app helps turn raw store data into useful insights. Instead of looking at disconnected numbers, merchants can see patterns, trends, and performance signals that support better business decisions.
The Problem with Manual Shopify Reporting
Many Shopify merchants still depend on manual reports, spreadsheets, and exported CSV files. While this may work in the early stages, it becomes inefficient as the store grows.
Manual reporting creates several problems.
First, it takes too much time. Store owners and managers may spend hours collecting data instead of focusing on strategy, marketing, product planning, or customer experience.
Second, manual analysis is prone to mistakes. A missed row, incorrect formula, or outdated spreadsheet can lead to inaccurate conclusions.
Third, manual reports are often delayed. By the time the report is ready, the opportunity may already be gone.
For example, a product may be gaining momentum, but if the trend is not noticed quickly, the merchant may fail to increase stock, improve promotion, or create related offers. On the other hand, a slow-moving product may continue consuming inventory space because its poor performance is not visible enough.
A Shopify analytics reporting app helps solve these issues by making reporting faster, clearer, and easier to access.
What Is a Shopify Analytics Reporting App?
A Shopify analytics reporting app is a tool that helps merchants analyze store data and understand business performance. It can provide reports on sales, products, customers, inventory, funnels, and key performance indicators.
Instead of manually collecting and organizing data, merchants can use an analytics app to view important insights in one place.
A strong reporting app should help answer questions such as:
What are my best-selling products?
Which products are underperforming?
How are sales changing over time?
Which periods have the strongest revenue?
What are my main store KPIs?
Where are customers dropping off?
What should I investigate or optimize next?
The goal is not just to show numbers. The goal is to help merchants make better decisions.
Key Features to Look for in a Shopify Analytics Reporting App
Not every reporting app offers the same value. When choosing an analytics solution for your Shopify store, focus on features that
directly support business decisions.
1. Historical Sales Trends
Historical sales trends help you understand how your store performs over time.
You can identify:
Seasonal sales patterns
Revenue growth or decline
High-performing sales periods
Slow periods that need marketing support
Changes in customer demand
For example, if your store consistently sees higher sales before holidays, you can prepare inventory, campaigns, and product bundles earlier. If sales decline after a specific period, you can investigate whether the issue is related to pricing, traffic, product availability, or customer behavior.
Historical reporting gives context to your numbers. It helps you understand not only what happened, but also when and why it may have happened.
2. Product Performance Insights
Product performance is one of the most important areas for Shopify merchants. Not all products contribute equally to revenue, profit, or growth.
A Shopify analytics reporting app can help you identify:
Best-selling products
Low-performing products
Products with strong potential
Products with weak sales momentum
Product categories that need attention
Inventory risks based on product movement
This helps merchants make better decisions about promotions, pricing, stock planning, product pages, and marketing campaigns.
For example, if a product receives attention but does not convert well, the issue may be product positioning, pricing, images, reviews, or description quality. If a product sells well but has limited inventory, the store may need to restock faster or promote alternatives.
Product analytics makes these decisions easier and more objective.
3. Store KPI Dashboard
A strong Shopify reporting app should help merchants monitor key performance indicators, also known as KPIs.
Important Shopify KPIs may include:
Total sales
Number of orders
Average order value
Conversion rate
Returning customer rate
Product revenue
Sales by period
Inventory performance
Funnel performance
These KPIs give merchants a clearer picture of store health.
For example, if total sales are increasing but average order value is decreasing, the store may be attracting more buyers but selling lower-value orders. If traffic is stable but conversion is declining, the issue may be related to checkout, pricing, product pages, or customer trust.
A KPI dashboard helps merchants see these signals faster.
4. Funnel Signals
A sales funnel shows the journey customers take before completing a purchase. A Shopify analytics reporting app can help merchants identify where customers may be dropping off.
Funnel signals can help answer questions such as:
Are customers viewing products but not adding them to cart?
Are customers adding products to cart but not checking out?
Are customers reaching checkout but abandoning the purchase?
Are certain products creating more drop-offs than others?
These insights are important because small improvements in the funnel can have a direct impact on revenue.
For example, if many customers abandon checkout, the merchant may need to review shipping costs, payment options, checkout experience, or trust signals. If customers view a product but do not add it to cart, the issue may be product images, pricing, product description, or offer clarity.
Funnel reporting helps merchants improve the buying journey with data instead of assumptions.
5. Reporting Gaps and Business Visibility
A good analytics app should also help merchants notice reporting gaps.
Many stores have data, but they do not always have clarity. Important information may be hidden, scattered, or difficult to compare.
Reporting gaps may include:
Lack of visibility into product performance
No simple view of sales trends
Unclear KPI tracking
Weak funnel reporting
Difficulty comparing periods
Too much dependence on manual exports
When these gaps are addressed, store owners can make decisions faster and with more confidence.
How Arka Helps Shopify Merchants Understand Store Data
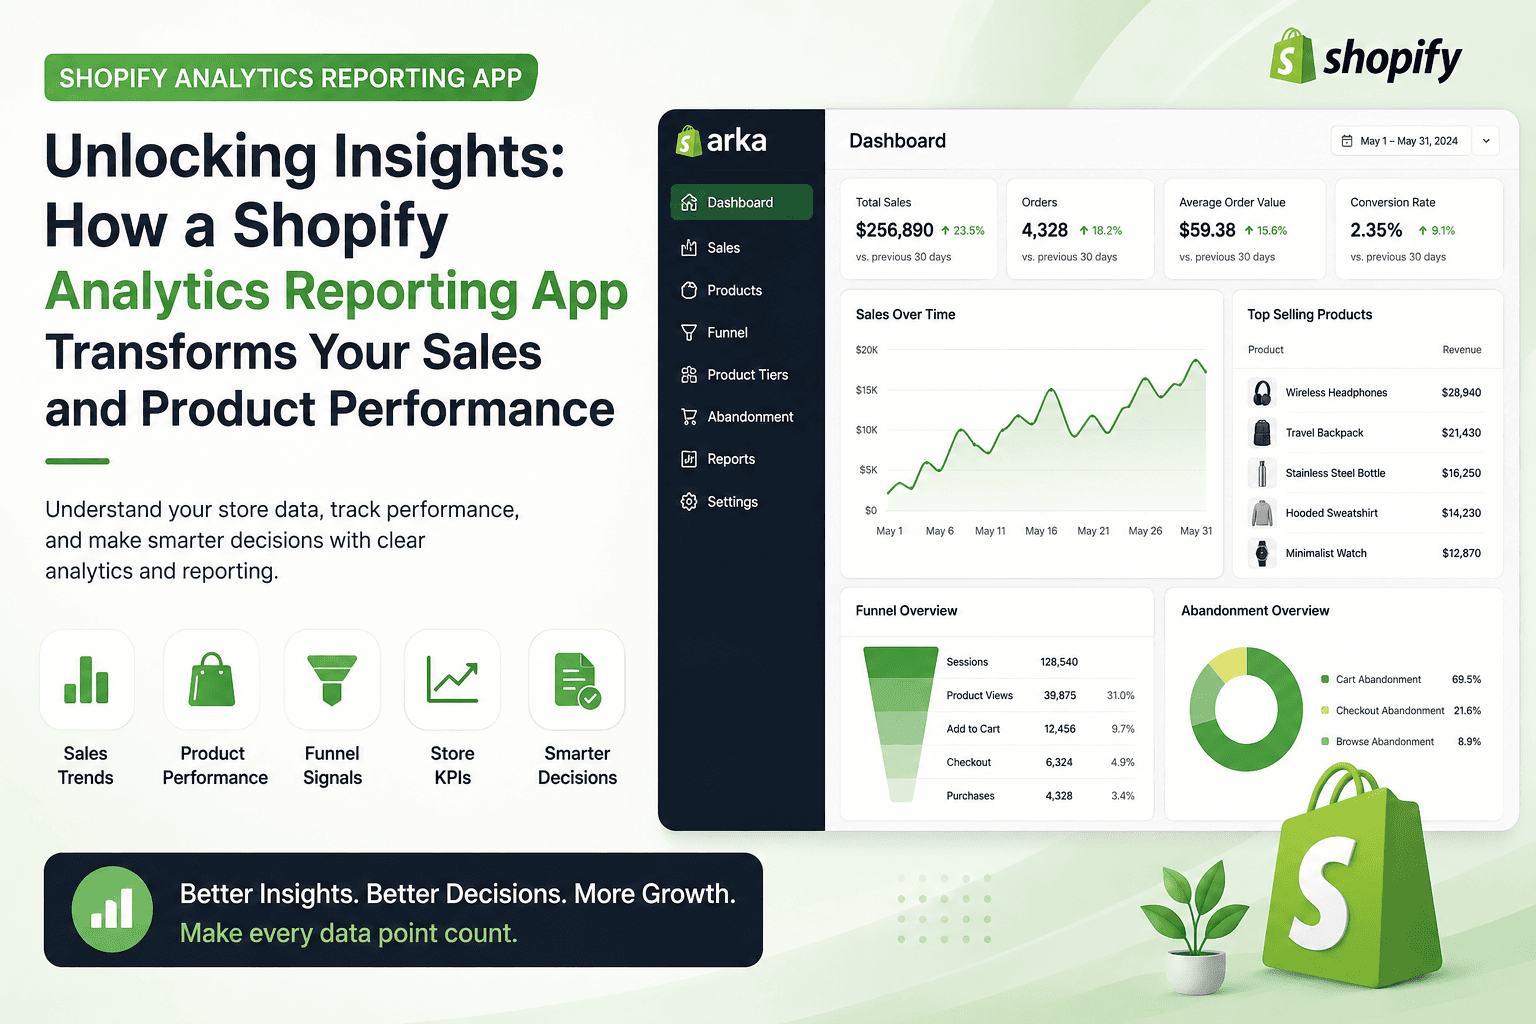
One example of a Shopify analytics reporting solution is Arka: Smart Analyzer.
Arka is designed to help Shopify merchants understand store performance through clearer analytics and reporting. Instead of spending hours reviewing spreadsheets, merchants can use Arka to review sales trends, product performance, store KPIs, funnel signals, and reporting opportunities inside their Shopify workflow.
Arka is useful for merchants who want a simpler way to understand historical data and make better decisions based on real store performance.
With Arka, Shopify merchants can focus on questions such as:
Which products are performing best?
Which products need attention?
How are sales changing over time?
What store KPIs should I monitor?
Where are customers dropping off?
What should I optimize next?
For growing Shopify stores, this kind of visibility can make reporting more practical and decision-making more efficient.
Benefits of Using a Shopify Analytics Reporting App
1. Save Time on Reporting
Manual reporting takes time. Exporting files, cleaning spreadsheets, building charts, and checking numbers can become a repeated burden.
A Shopify analytics reporting app reduces this workload by organizing important data into clear reports and dashboards.
This allows store owners and teams to spend more time on actions that create growth, such as improving product pages, testing campaigns, planning inventory, and optimizing customer experience.
2. Make Better Business Decisions
Data is only useful when it supports decisions.
A Shopify analytics reporting app helps merchants move from guessing to analyzing. Instead of asking, “Why did sales drop?” without clear evidence, merchants can review trends, products, and funnel signals to find possible causes.
Better decisions may include:
Promoting high-performing products
Fixing weak product pages
Adjusting inventory plans
Creating bundles or upsells
Improving checkout experience
Reviewing pricing strategy
Identifying seasonal demand patterns
The more clearly a merchant understands store performance, the easier it becomes to choose the next action.
3. Improve Product Strategy
Product strategy is not only about adding new products. It is also about understanding which products deserve more attention.
Analytics can help merchants decide:
Which products to promote
Which products to discount
Which products to restock
Which products to remove
Which products to bundle
Which categories need improvement
This is especially important for stores with many SKUs. Without product performance reporting, it becomes difficult to know which products are truly supporting growth.
4. Support Marketing Decisions
Marketing without analytics can waste budget. Merchants need to understand whether campaigns are actually helping sales and whether the right products are being promoted.
A reporting app can help merchants connect sales performance with business activity. If a campaign increases traffic but not orders, the issue may be conversion. If a campaign increases orders but lowers average order value, the offer may need adjustment.
Analytics helps marketing become more focused and less reactive.
5. Make Analytics Easier for Non-Technical Teams
Not every Shopify merchant has a data analyst. Many stores are managed by founders, small teams, marketers, or operations managers.
A good Shopify analytics reporting app should be easy to understand without technical knowledge. Reports should be clear, practical, and connected to real store decisions.
This makes analytics more accessible across the business.
Practical Examples of Shopify Analytics in Action
A Shopify merchant may use product performance analytics to discover that a product sells well during a specific season. With this insight, the merchant can prepare inventory earlier and create targeted campaigns before demand increases.
Another merchant may notice that certain products receive interest but do not convert well. This could lead to improvements in product images, descriptions, pricing, or reviews.
A store may also identify that customers frequently abandon checkout. With that information, the merchant can review shipping fees, payment methods, checkout steps, or trust-building elements.
These are not just reports. They are decision points. The value of analytics comes from using the data to take action.
How to Choose the Right Shopify Analytics Reporting App
Before installing an analytics app, merchants should evaluate whether it matches their business needs.
Here are a few important criteria:
1. Relevant Reports
The app should provide reports that actually help you run your store. Sales trends, product performance, KPIs, and funnel insights are more useful than generic charts with no clear action.
2. Easy Shopify Integration
The app should work smoothly with Shopify and fit into your existing workflow. The easier it is to access and understand the data, the more likely your team will use it consistently.
3. Clear Dashboard
A strong dashboard should make data easier to understand, not more complicated. Look for clean reporting, simple navigation, and practical insights.
4. Product and Sales Visibility
For most Shopify stores, product performance and sales trends are essential. Choose an app that helps you understand both.
5. Actionable Insights
The best analytics tools do more than display numbers. They help merchants understand what needs attention and where improvement opportunities may exist.
Getting Started with a Shopify Analytics Reporting App
If you want to improve your Shopify reporting, start with a simple process.
First, define the most important questions you want to answer. For example, you may want to know which products are underperforming, which sales periods are strongest, or where customers are dropping off.
Second, choose an analytics app that supports those questions.
Third, review your reports regularly. Analytics should not be checked only when there is a problem. It should become part of your weekly or monthly decision-making process.
Fourth, turn insights into action. If a product is underperforming, investigate it. If a trend is growing, support it. If a funnel issue appears, test improvements.
The goal is not just to collect data. The goal is to use data to improve store performance.
Why Arka Is a Smart Choice for Shopify Analytics Reporting
If you are looking for a simpler way to understand your Shopify data, Arka: Smart Analyzer can help.
Arka gives Shopify merchants clearer visibility into sales performance, product insights, store KPIs, funnel signals, and historical trends. It is designed for merchants who want practical reporting without spending hours inside spreadsheets.
With Arka, you can better understand what is happening in your store and make more informed decisions about products, sales, and growth opportunities.
Instead of guessing what to improve next, Arka helps you use your existing Shopify data as a decision-making tool.
Conclusion
A Shopify analytics reporting app can transform the way merchants understand and manage their stores. By making sales trends, product performance, KPIs, funnel signals, and reporting gaps easier to see, analytics apps help merchants make faster and smarter decisions.
Manual reporting can slow your business down. Clear analytics can help you identify opportunities, reduce guesswork, and improve store performance over time.
If you want to turn your Shopify data into clearer business insights, try Arka: Smart Analyzer.
Arka helps Shopify merchants understand sales, products, funnels, and KPIs with practical analytics designed for better eCommerce decisions.
Advertising Copy for Arka
Stop guessing. Start understanding your Shopify store data.
Arka: Smart Analyzer helps Shopify merchants turn sales history, product performance, funnel signals, and store KPIs into clear, actionable insights.
No complex spreadsheets. No manual reporting. No confusing dashboards.
With Arka, you can track historical sales trends, identify top and underperforming products, monitor store KPIs, and find optimization opportunities faster.
Install Arka: Smart Analyzer today and turn your Shopify data into smarter growth decisions.